QUALITY APPS
Cpk App
This weekend I was working in my Cpk Web App, yesterday I added it to my Webpage https://qualityapps.net/. I designed it to be able to perform the Normality Test first and then the respective Cpk calculation with plot (Normal Data or Non-Normal Data). Feel free to use it in your daily manufacturing activities.
Data Requirements:
Minimum Sample Size: 30 data points.
Maximum Sample Size: 5000 data points.
Data must be numeric and separated by spaces, commas, or newlines.
Normality Test:
The application uses the Jarque-Bera test to determine if the input data follows a normal distribution. This test evaluates the data's skewness and kurtosis. A p-value greater than 0.05 suggests the data is likely normal.
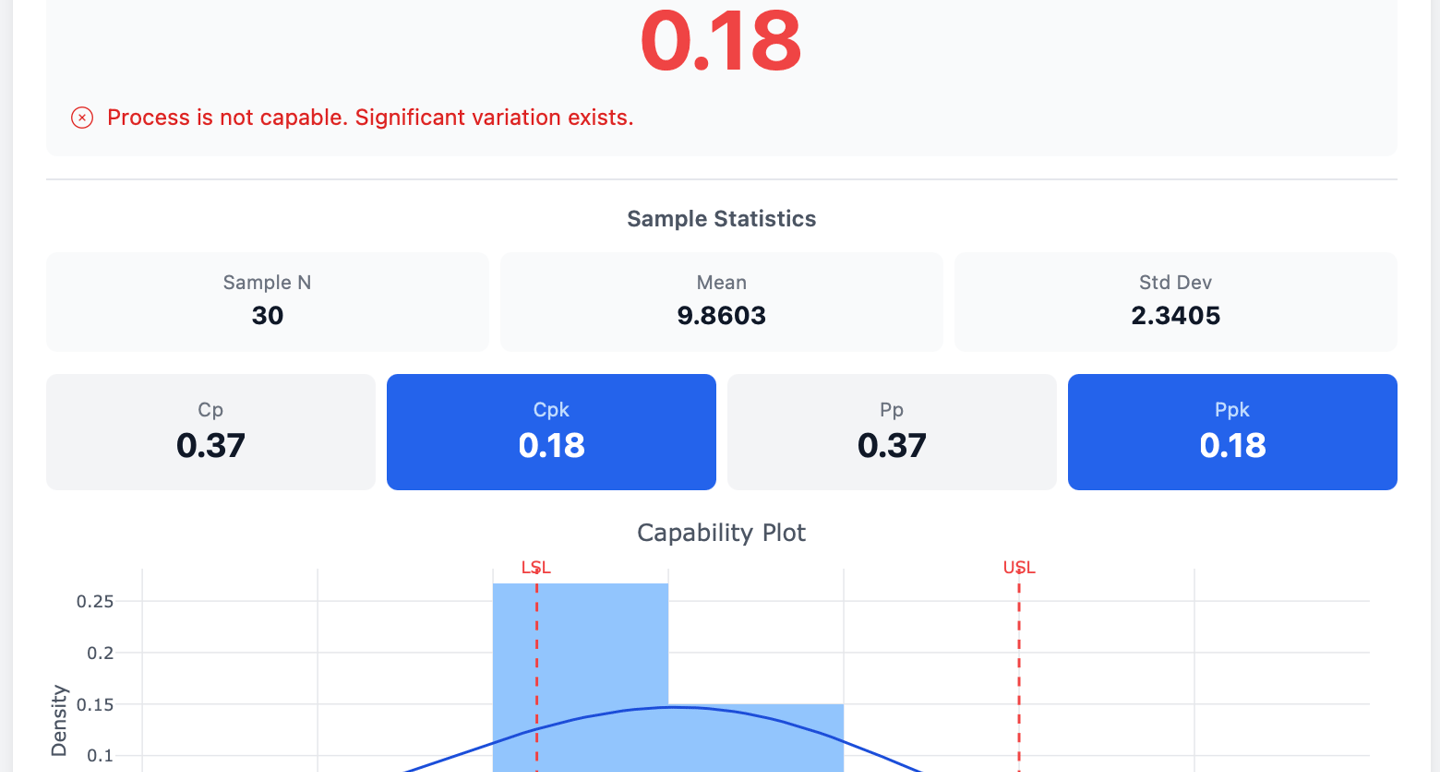
Capability Calculation (Normal Data):
For data that is normally distributed, capability indices (Cp, Cpk, Pp, Ppk) are calculated using the standard method, which relies on the sample mean and overall standard deviation relative to the specification limits.
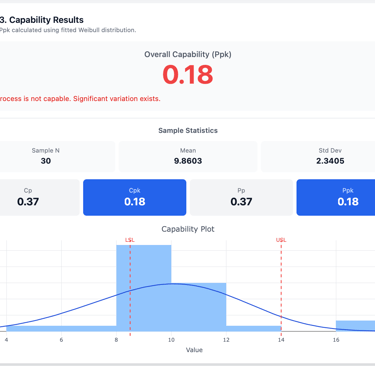
Capability Calculation (Non-Normal Data):
For non-normal data, the application uses the Percentile Method (ISO 22514-2). Instead of mean and standard deviation, this robust method uses percentiles from the fitted distribution (e.g., Weibull, Lognormal) to determine process capability. Specifically, it uses the 0.135th, 50th (median), and 99.865th percentiles, which correspond to the ±3σ range in a normal distribution.
Apps
Explore our quality apps for productivity and efficiency.
Tools
Support
© 2025. All rights reserved qualityapps.net